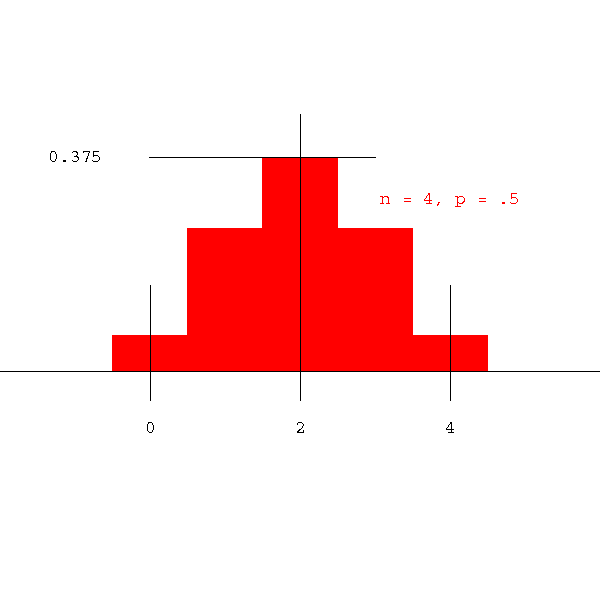
The exhibit How much where shows, among other things, how the binomial distribution changes as n, the sample size, grows. The center of mass moves to the right, the height of the tallest column decreases and the distribution flattens out. However, the spreading that occurs is small compared to the movement of the center of mass, meaning that realtive to the mean of the distribution, the amount of spreading decreases.
Suppose we correct for position and spread by adjusting the display so that center of the picture is the mean and the width is always whatever it needs to be to include 99% of the distribution? See waht happens below: