How to stop animations.
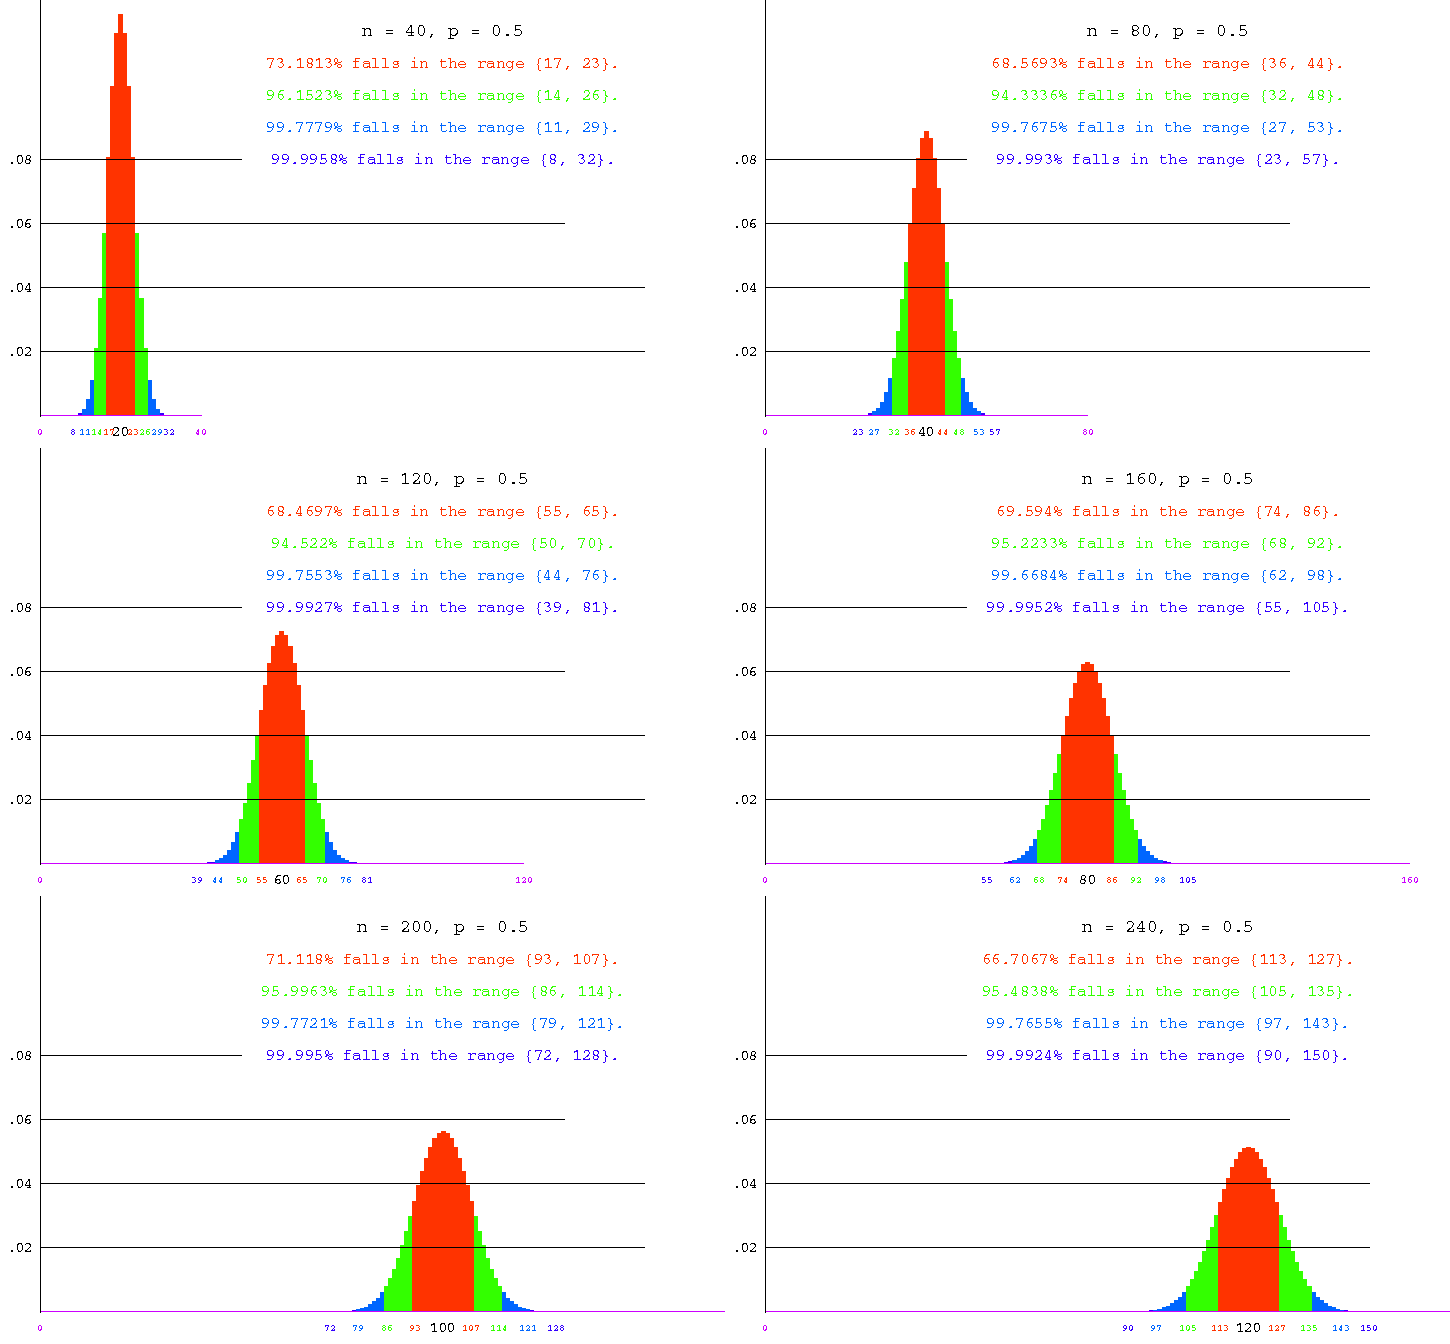
The animation shows the binomial distributions obtained for p = 1/2 and n = 40, n = 80, n = 120, n = 160, n = 200 and n = 240.
As a heuristic, let's attach a concrete meaning to the column heights. Suppose a huge jar is filled with beads, and the proportion of black beads is p. In any frame, the height of the column labeled "i" is the probability that, in a random sample of n beads drawn from the jar, i will be black. (The jar must have an enormous number of beads. The reason is that if the number of beads is small, then removing some may change the proportion black remaining in the jar. The sampling distribution, consequently, would not be binomial but something else. The binomial distribution arises when the probability of each bead being black is the same and when in addition the colors of some beads in a sample do not influence the probability of any of the others being black. To guarantee this absolutely, one actually needs to assume an infinite number of beads, but the differences from the binomial that arise if the number of beads is finite---but much, much larger than the sample---are small.)
The total height of several selected columns is the probability that, in a random sample of n beads, the number black will be one of the numbers labeling a selected columns. Thus, the total height of all the columns is 1.
We now explain the coloring. Consider first a specific instance. In the frame with n = 240, the columns labeled 113 through 127 are colored orange. Now, the orange text says, 66.7067% of all samples of size 240 will contain between 113 and 127 black balls; this figure was obtained by adding together the heights of all the orange columns, which gives a result of .667067. Similarly, the dark blue text says that 99.9924% of all samples will contain between 90 and 150 black balls.
The general scheme for coloring is as roughly as follows. In each picture, we work outward from the mean (the column with the black label), coloring columns orange until approximately 70% of the distribution is taken in. Continuing in green, we color enough to take in approximately 95%, then light blue to approximately 99% and finally dark blue to 99.99%.
To be more precise, to determine the coloring we computed the standard deviation for each distribution, and then colored in orange the columns within 1 standard deviation of the mean. Green, light blue, and dark blue were used for 2, 3 and 4 standard deviations respectively. For example, the standard deviation of the binomial distribution with n = 40 and p = 1/2 is the square root of 10, or 3.1622. The columns marked 17 through 23 are within one standard deviation of the mean, so they are colored orange. See the table following the animation.
|
n |
mean |
standard deviation |
range (orange) |
fraction in range |
|
40 |
20 |
3.16 |
17--23 |
.73181 |
|
80 |
40 |
4.47 |
36--44 |
.68569 |
|
120 |
60 |
5.48 |
55--65 |
.68469 |
|
160 |
80 |
6.32 |
74--86 |
.69594 |
|
200 |
100 |
7.07 |
93--107 |
.71118 |
|
240 |
120 |
7.75 |
113--127 |
.66706 |