In summer of 1998, I had 23 students in a M1100 class. I asked each of them to gather data on 20 LSU students. Among other things, they were to determine the handed-ness of each of the 20 students they interviewed. Everyone happened to question at least one left-handed person. One reported that 10 of the 20 people interviewed were left-handed. Here are the results:
|
k
|
0
|
1
|
2
|
3
|
4
|
5
|
6
|
7
|
8
|
9
|
10
|
>10
|
|
number of samples with k lefties
|
0
|
1
|
3
|
4
|
5
|
1
|
2
|
3
|
2
|
1
|
1
|
0
|
|
proportion of samples with k lefties
|
0.0
|
.043
|
.130
|
.174
|
.217
|
.043
|
.087
|
.130
|
.087
|
.043
|
.043
|
0.0
|
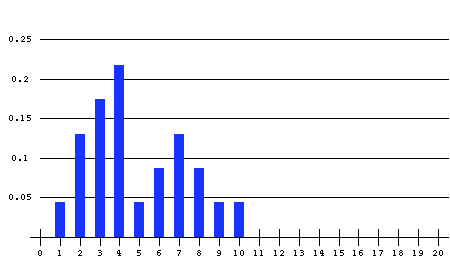
This same data can be graphed as follows, where the labels on the horizontal axis are the k-values (number of lefties) and column heights are the corresponding proportions, as in the table above:

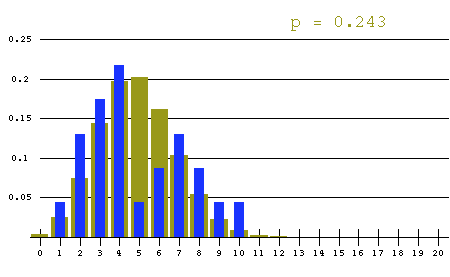
The mean number of lefties per sample was 4.87, for a proportion of .243. With the assumption that the samples were truly random, this is our best estimate for the proportion of lefties in the entire population. Since the population is quite large, the (theoretical) sampling distribution is essentially binomial. The following graph compares the binomial distribution with n = 20 and p = .243 with the distribution obtained from the class:

Here is a Quicktime movie that compares the binomial distributions for several different p-values to the distribution of the class's samples. The same movie is also available in GIF format, in case your browser does not support the movie.
The blue distribution is more "spread out" than the binomial distribution, as you can see from the fact that the blue columns at k = 1, 2, 3, 4, 7, 8, 9 and10 are higher than the corresponding columns for the binomial. What are we to make of this? More on the lefties: variance.